Design and evaluation of a novel sub-scaffold dental implant system based on the osteoinduction of micro-nano bioactive glass
Fujian Zhao1, Zhen Yang2,3, Lu Liu2,3, Dafu Chen4, Longquan Shao1,*( ), Xiaofeng Chen2,3,*()
), Xiaofeng Chen2,3,*()
.
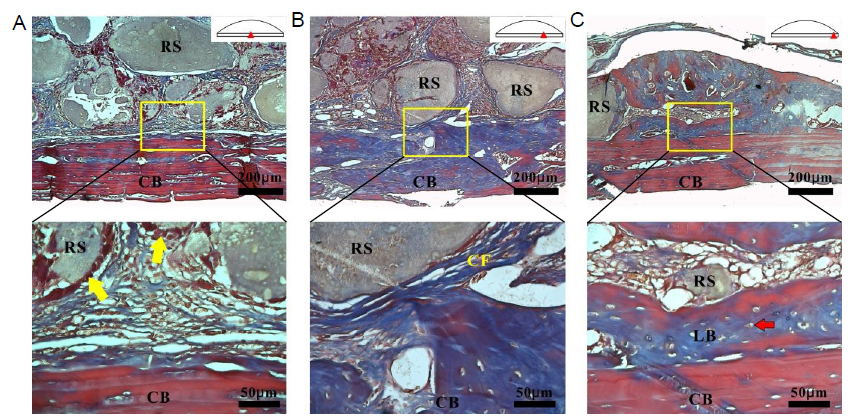
Figure 4.. Histological analysis of the MNBG scaffolds and cortical bone after Masson’s trichrome staining. (A, C) Centre and edge areas. (B) Area between edge and centre, as shown in the schematic diagram. The yellow boxes show the areas which are enlarged below. The yellow arrows indicate osteoblasts and the red arrow indicates an osteocyte. Scale bars: 200 μm (upper panel), 50 μm (lower panel). CB: cortical bone; CF: collagen fibres; LB: pre-lamellar bone; MNBG: micro-nano bioactive glass; RS: residual scaffolds.