


Introduction
Mesenchymal stem cells (MSCs) are often used as seed cells in bone tissue engineering due to their osteogenic differentiation potential. The extracellular matrix around MSCs plays important roles in regulating their survival, proliferation, and differentiation.1 A growing number of investigations have focused on the effect of the extracellular matrix on the osteogenic differentiation of MSCs.
Substrate topography modulates the differentiation of MSCs. For example, some studies revealed that an increase in substrate roughness up to a value of 1 μm promotes the osteogenic differentiation of MSCs,2, 3 but osteogenesis is significantly reduced when substrate roughness increases to a value more than 1 μm.4-6 In substrates with micropillars that are perpendicular to the substrate surface, taller micropillar structures might promote osteogenic differentiation.7-10 When particles at the nanometre scale are distributed on substrates, spherical nanoparticles of 40 or 70 nm in diameter and rods of 70 nm in diameter promote the osteogenic differentiation of MSCs, and small gold nanoparticles increase the level of osteogenesis.11, 12
In addition to substrate topography, the effect of adhesion morphology, such as spreading area or individual cell shape, on the fate of MSCs, has also been studied. A large spreading area significantly increases osteogenesis of MSCs and decreases their adipogenesis.13, 14 This finding is consistent with the effect of cell density; that is, high density may reduce the osteogenesis of MSCs possibly due to the decrease in area available to each cell.13, 15, 16 When MSCs are cultured on rectangular micropatterns with different aspect ratios, the proportion of osteogenic differentiation decreased linearly with aspect ratio,17 suggesting that the shape index of MSCs also regulates osteogenesis.
Cells adhere to substrates mainly through focal adhesion complexes, which consist of hundreds of proteins, such as integrin, vinculin, and paxillin.18 Focal adhesions link intracellular actin bundles (F-actin) with the extracellular matrix through the transmembrane protein, integrin. When the extracellular environment changes, the cytoskeleton reorganises and regulates the fate of stem cells.13, 19, 20 Micropattern technology has been used to construct a substrate with adhesive islands for single or multiple cells, and the effect of functional groups and nanofibrous architecture of substrate material on MSC osteogenesis through cell adhesion and the cytoskeleton has been investigated.21, 22 However, whether a substrate with focal adhesion-scale adhesive micropatterns can direct the fate of MSCs remains unknown.
In this study, we designed a substrate with self-assembled molecular micropatterns with different areas and spacing, and analysed the osteogenic differentiation of MSCs and MC3T3-E1 cells. The expression of F-actin, phosphorylated myosin light chain 2 (P-MLC2), and yes-associated proteins (YAP) was also studied.
Methods
Fabrication of micropatterned substrates
Three circular patterns with different areas and spacing were designed to regulate the distribution of focal adhesions. The patterns consisted of large circles with large spacing (LL), small circles with large spacing (SL), or small circles with small spacing (SS). The geometric parameters of the three patterns are given in Table 1. These designed patterns were fabricated on a chromium mask, which were replicated to a master made of positive photoresist on a silicone wafer exposed to ultraviolet radiation. A mixture of Dow Corning 184 gel (Midland, MI, USA) and curing agent (10:1) was poured onto the silicone wafer, and then cured at 80°C in an oven for 2 hours to create a polydimethylsiloxane stamp with the designed pattern, which was then peeled from the surface of the silicone wafer, as described in our previous papers.23-26 The polydimethylsiloxane stamp was hydrophilised by sputtering oxygen ions onto its surface with an SBC-12 ion sputter coater (KYKY Technology Company, Beijing, China). Polydimethylsiloxane is a synthetic polymer material that controls the spread of cells without affecting their growth state because of its strong anti-protein adsorption.27 A non-adhesive comb polymer (Suzhou Nanotechnology Institute of CAS, Suzhou, China) was used and remained stable for approximately 3 months.28 One droplet of a comb polymer solution was placed onto the stamp surface and centrifugated at 403 × g to create a uniform coating. Finally, the stamp was gently pressed onto a culture plate for 10 seconds to transfer the designed patterns onto the plate surface (Figure 1A). The morphology of the adhesive islands for cell adhesion was observed under an optical microscope (Leica DMI 6000, Wetzlar, Germany) (Figure 1B). It should be noted that the adhesive circular islands were made of self-assembled molecular monolayer with a thickness less than 40 nm.28 In addition, the areas of adhesive islands were less than the physiological spreading areas of the cells so that the cells may spread across several adhesive areas to study the effect of focal adhesion on the biological behaviours of the cells.
Table 1 Geometric parameters of the three patterns.
| Pattern | Diameter (μm) | Area (μm2) | Spacing (μm) | Pattern area/total area (%) |
|---|---|---|---|---|
| LL | 12 | 113 | 36 | 9 |
| SS | 8 | 50 | 24 | 9 |
| SL | 8 | 50 | 36 | 4 |
Note:LL: large circles with large spacing; SL: small circles with large spacing; SS: small circles with small spacing.
Figure 1.
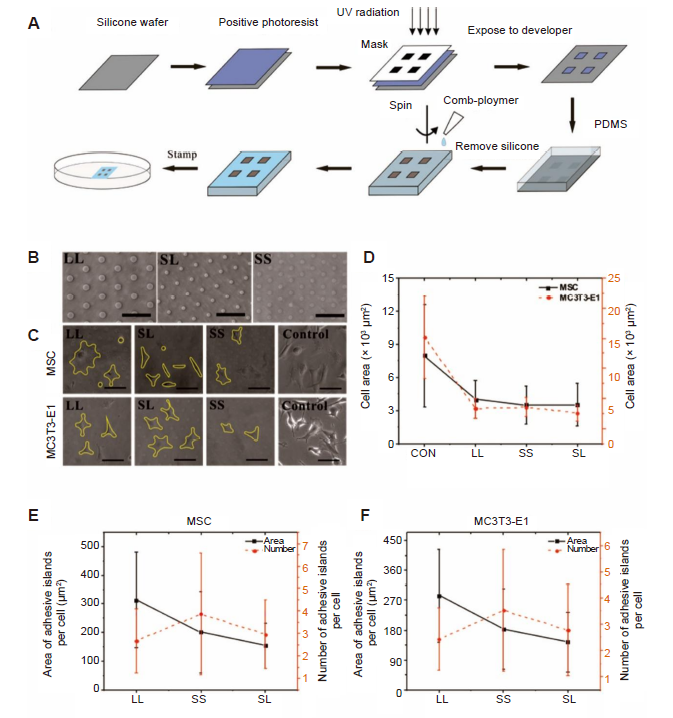
Figure 1.
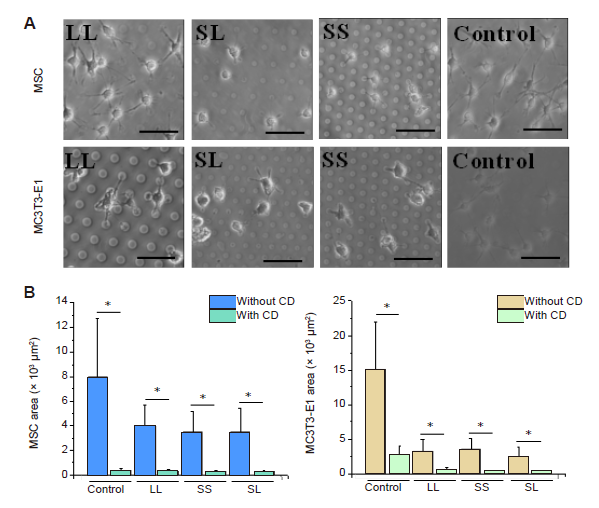
Micropatterned substrate and cell culture. (A) The process of micropatterning. (B) Bright-field images of micropatterned substrates. (C) Bright-field images of cells cultured on the micropatterned or blank substrates for 3 days. The yellow lines show the outline of the cells. The free-spreading cells showed polygons, while the spreading area of the patterned cells decreased. Scale bars: 50 μm. (D) Spread area at 3 days of cell culture. (E, F) Statistical analysis of the area and number of adhesive islands after 3 days of culture. Data are presented as mean ± SD (n = 3), and were analysed by one-way analysis of variance followed by Tukey’s post hoc analysis. CON: control (freely spreading group); LL: large circles with large spacing; MSC: mesenchymal stem cell; PDMS: polydimethylsiloxane; SL: small circles with large spacing; SS: small circles with small spacing; UV: ultraviolet.
Cell culture
Mouse (C57BL/6) bone marrow MSCs (RRID:CVCL_2I36) were purchased from Gibco (Carlsbad, CA, USA), and the MC3T3-E1 cell line (RRID:CVCL_5437) was purchased from the American Type Culture Collection (Manassas, VA, USA). The cells were cultured at 37°C in α-minimum essential medium (Hyclone, Logan, UT, USA) supplemented with 10% foetal bovine serum (Gibco) and 1% penicillin and streptomycin (Hyclone). The cells were seeded onto micropatterned six-well culture plates at a density of 3 × 10³ cells/cm2 on the adhesive region. After 30 minutes of attachment, the culture plate was gently washed to remove unattached cells. We did not use osteogenic induction medium so as to investigate the exclusive effects of focal adhesion on osteogenic differentiation. For disrupting cytoskeleton, the cells were seeded in a medium culturing with 1 μg/mL cytochalasin D (ab143484, Abcam, Cambridge, UK) for 24 hours to inhibit actin polymerization. The circularity of cell spread shape (circularity = 4π × area/perimeter2)29 was calculated to evaluate changes in morphology.
Apoptosis assay
A one-step terminal deoxynucleotidyl transferase dUTP nick end labelling (TUNEL) apoptosis assay kit (C1088, Beyotime, Jiangsu, China) was used to detect the apoptosis of micropatterned MSCs and MC3T3-E1 cells cultured for 3 and 7 days respectively. After treatment with 4% paraformaldehyde, the cells were permeabilised with 0.3% Triton X-100 for 5 minutes at room temperature and incubated with the TUNEL reaction mixture for 60 minutes at 37°C in a humidified atmosphere in the dark and then rinsed with phosphate-buffered saline (PBS). The cell nuclei were counterstained with 0.1% Hoechst 33342 stain in PBS in the dark for 10 minutes. Under a fluorescence microscope (Leica DMI 6000), the cells undergoing apoptosis were revealed by green fluorescence of the nuclear regions, which was calculated by ImageJ software (v1.8.0).30
Fluorescent staining of differentiation markers, YAP and P-MLC2
After the cells were grown on the micropatterned substrates for 3 or 7 days, they were gently washed with PBS, fixed with 4% paraformaldehyde in PBS for 30 minutes at room temperature, and permeabilised with 0.2% Triton X-100 in PBS for 10 minutes at room temperature. The cells were blocked with 5% bovine serum albumin (Boster, Wuhan, China) for 30 minutes, incubated with goat anti-mouse polyclonal antibodies (Santa Cruz Biotechnology, Santa Cruz, CA, USA) against alkaline phosphatase (ALP, Cat# sc-365765), type I collagen (COL I, Cat# sc-59772), or osteocalcin (OCN, Cat# sc-390877) at a 1:100 dilution for 60 minutes at 37°C, washed with PBS three times, and incubated in the dark for 60 minutes at room temperature with a fluorescein isothiocyanate-labelled affinity-purified antibody to goat IgG (Invitrogen) at a 1:1000 dilution. The staining method used for YAP (A1002, ABclonal, Woburn, MA, USA) and tetraethyl rhodamine isothiocyanate-labelled P-MLC2 (Cat# 3674, Cell Signaling Technology, Boston, MA, USA) was the same as described above. Fluorescence images of these proteins were analysed by ImageJ software. The nuclear/cytoplasmic ratio of YAP in MSCs and MC3T3-E1 cells was obtained by dividing the intensity value in the nucleus to that in the cytoplasm.
F-actin measurements
After the cells were grown on a micropatterned surface for 3 or 7 days, they were fixed for 5 minutes in 4% formaldehyde solution in PBS and permeabilised with 0.2% Triton X-100 in PBS for 10 minutes at room temperature. Then, the cells were stained with a 50 mg/mL fluorescein isothiocyanate phalloidin conjugate solution (Sigma-Aldrich, St. Louis, MO, USA) in PBS for 40 minutes at room temperature. Cell spreading morphology was observed under a fluorescence microscope. The consistency of F-actin was calculated by using the Measurement program in the plugin of ImageJ software. A coherency value of 1 indicates a dominant orientation of local image features, while a coherency of 0 indicates no orientation.31 The larger the value, the more ordered the actin filaments, and the more consistent the direction of stress fibres.
Statistical analysis
All experiments were performed at least in triplicate, and at least 30 cells were measured for each group. The fluorescent intensity of individual cells was measured using ImageJ software. Data are presented as mean ± standard deviation (SD) if not stated otherwise. One-way analysis of variance with Tukey’s post hoc analysis was performed to identify any statistically-significant differences between the mean values of different groups (P < 0.05) by Origin software (OriginLab Corp., Northampton, MA, USA).
Results
Adhesion patterning reduces cell spreading
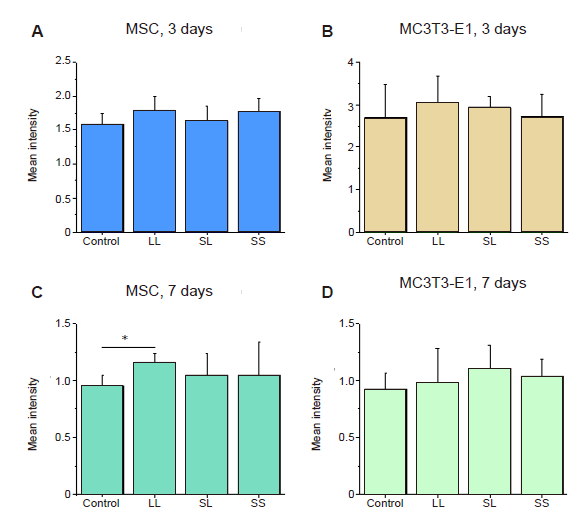
First, the cells cultured on the micropatterned substrate were checked to ensure they were alive and the effect on their spreading was evaluated. At 3 or 7 days after MSCs and MC3T3-E1 cells were inoculated onto the micropatterned substrates with different spacing and area, their spreading and growth were observed under an optical microscope. As shown in Figure 1C, the cells were capable of spreading on the LL, SL, and SS micropatterned substrates; however, the spreading areas of the cells were significantly reduced compared with those of cells cultured on a control blank substrate without any micropatterns (CON) (Figure 1D). Most cells spanned several adhesion spots regardless of the patterns. No significant differences were seen among the different areas on the micropatterned substrate. Apoptosis assay results showed that cell viability was similar on the micropatterned surfaces compared to cells cultured on the blank control surface (Additional Figure 1).
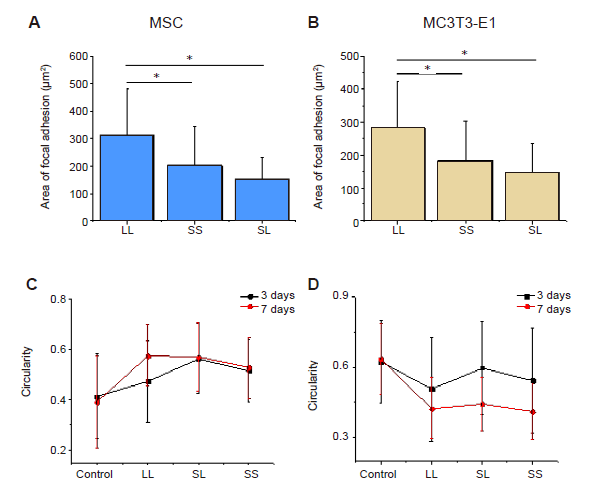
In addition to the spread area of the cells, we quantitatively analysed the number and area of adhesion islands for each cell (Figure 1E, F, and Additional Figure 2A, B). It should be noted that the MSCs or MC3T3-E1 cells on the LL pattern had larger adhesive areas than those on the SL pattern even though both patterns had the same overall ratio of patterned area to total area, and the cells on the SS pattern occupied the smallest adhesive area. In addition, the number of adhesive islands per cell on the SS pattern was the greatest, while that on the LL pattern was the least. We also observed that the morphology of patterned cells differed significantly from that of cells allowed to spread freely (Figure 1C). Therefore, circularity of cell spread shape was calculated to evaluate changes in morphology. The results suggested that a patterned substrate would increase the circularity of MSCs but decrease the circularity of MC3T3-E1 cells (Additional Figure 2C and D).
Adhesion patterns mediate the cytoskeletal tension of MSCs and MC3T3-E1 cells
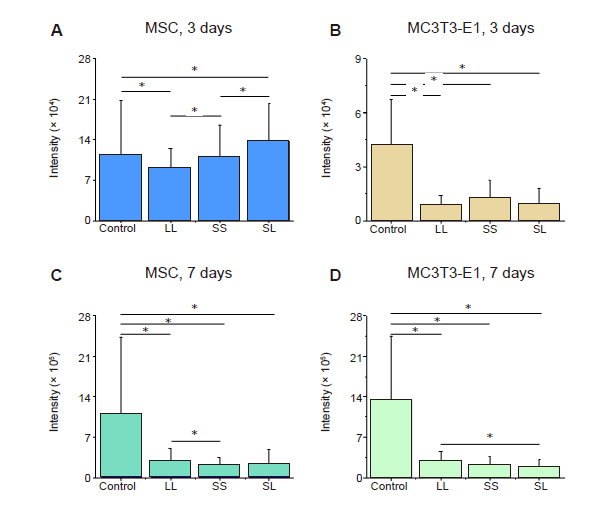
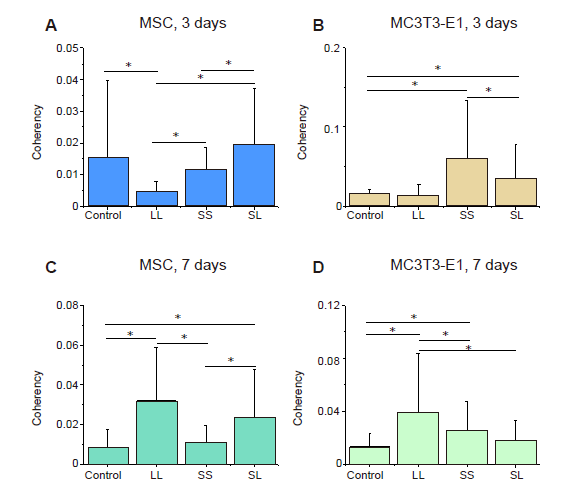
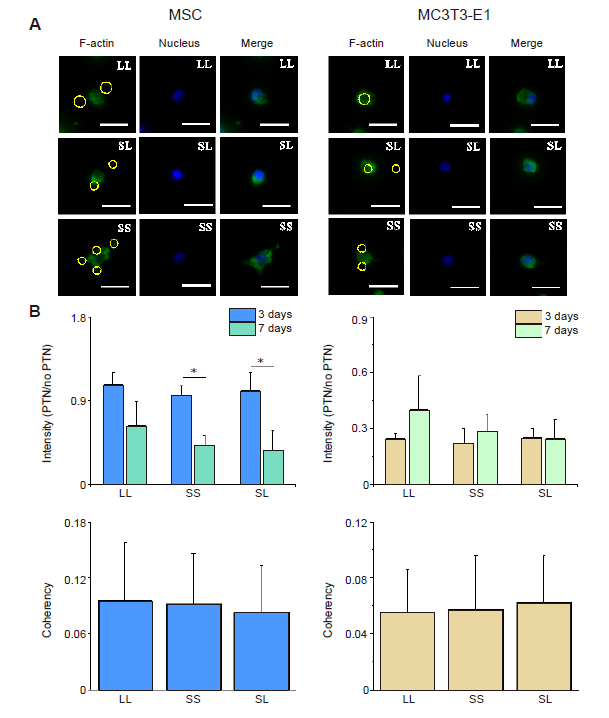
We speculated that the area and spacing of focal adhesion complexes would lead to cytoskeleton reorganisation, thereby changing skeletal tension. When the MSCs and MC3T3-E1 cells were cultured on micropatterned surfaces (Figure 2A and B), they spread across different numbers of adhesion spots creating different geometric shapes, such as triangles, diamonds, and dumbbells. Statistical analyses of the fluorescent intensity of F-actin in the micropatterned cells relative to un-patterned cells after 3 days of culture showed that MSCs on the SL pattern had the highest content of actin filaments while those on LL had the lowest (Figure 2C, and Additional Figure 3A, C). However, the relative intensity of F-actin was significantly reduced when the cells were cultured for 7 days compared with that of the group cultured for 3 days, and at 7 days the F-actin content of cells on LL was higher than those on SS and SL. The difference in F-actin expression in MC3T3-E1 cells was not significant at 3 days, but the cells on LL had a significantly higher level of F-actin compared with those on SL after 7 days of culture (Figure 2D, and Additional Figure 3B and D). Given that the cytoskeleton generates mechanical forces and is involved in cell adhesion,32 the force on the cytoskeleton is likely to be related to the arrangement of stress fibres and can be revealed by the coherency of F-actin. Therefore, consistency is a more important parameter to measure the cytoskeletal distribution.33 The statistical results showed that MSCs on SL after 3 days of culture had the highest consistency (Figure 2E, and Additional Figure 4A and C). However, at 7 days, F-actin consistency on LL was the highest. The arrangement of F-actin in MC3T3-E1 cells changed with culture duration (Figure 2F, and Additional Figure 4B, and D); that is, after 3 days of culture, the intracellular cytoskeleton on SS was highly consistent. However after 7 days of culture, LL promoted the arrangement of actin. Interestingly, these characteristics were exactly the same as those of F-actin, indicating that a high actin protein content improves alignment. Similar to the situation observed under an optical microscope, the cytoskeleton staining of MSCs and MC3T3-E1 cells also showed that compared with control group, the spreading area of patterned cells was reduced, and the spreading shape was similar.
Figure 2.
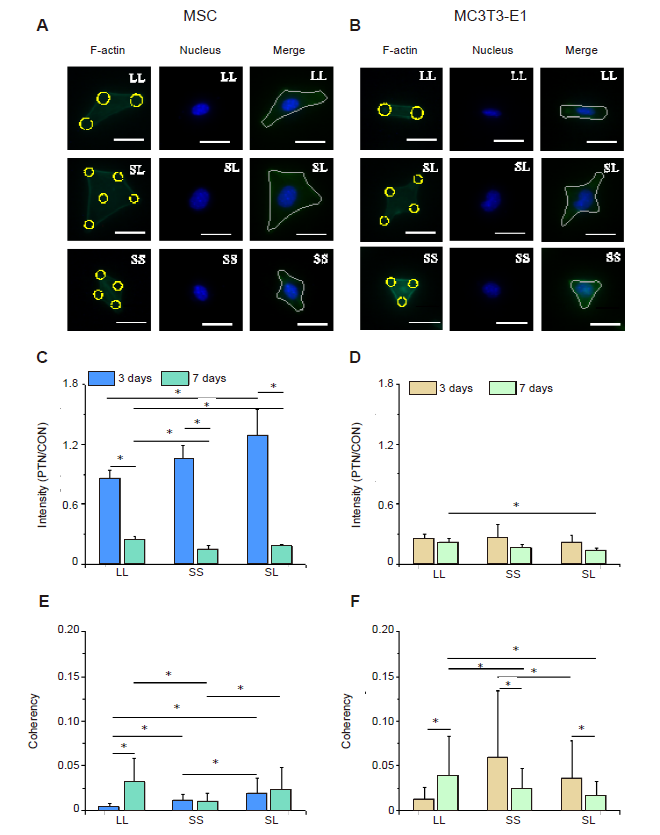
Figure 2.
F-actin distribution in cells cultured on micropatterned substrates. (A, B) Fluorescent images of individual MSCs (A) and MC3T3-E1 cells (B) stained with phalloidin-labelled F-actin (green) with Hoechst 33342-stained nuclei (blue) at 3 days after seeding. Cells could be spread out into triangles, dumbbells, etc. The yellow circles represent the location of micropatterned islands. The gray shape represents the spreading shape of cells. Scale bars: 50 μm. (C, D) Statistical results of F-actin in MSCs (C) and MC3T3-E1 cells (D). (E, F) Statistical results of F-actin coherency in MSCs (E) and MC3T3-E1 cells (F). The larger the value, the more ordered the actin, and the more consistent the direction of stress fibres. Data are presented as mean ± SD (n = 3). *P < 0.05 (one-way analysis of variance followed by Tukey’s post hoc analysis). CON: control (freely spreading group); LL: large circles with large spacing; MSC: mesenchymal stem cell; PTN: pattern; SL: small circles with large spacing; SS: small circles with small spacing.
In addition to changes in F-actin, intracellular tension may be associated with phosphorylated myosin. Conventional myosin is a hexameric protein consisting of two heavy-chain subunits, a pair of non-phosphorylated light chains, and a pair of phosphorylated light-chain subunits.34 In the present study, P-MLC2 was stained for analysis of its content. The fluorescent images clearly showed the distribution of P-MLC2 in cells (Figure 3A and B). Statistical results showed that MSCs cultured for 3 days had significantly higher P-MLC2 expression than those cultured for 7 days (Figure 3C, and Additional Figure 5A and C). The relative intensity of P-MLC2 in cells grown on the SL pattern was the highest in the 3 days group, but that on the LL pattern was the highest in the 7 days group. In MC3T3-E1 cells inoculated onto the LL pattern, P-MLC2 was higher in the 3 days group than in the 7 days group (Figure 3D, and Additional Figure 5B and D).
Figure 3.
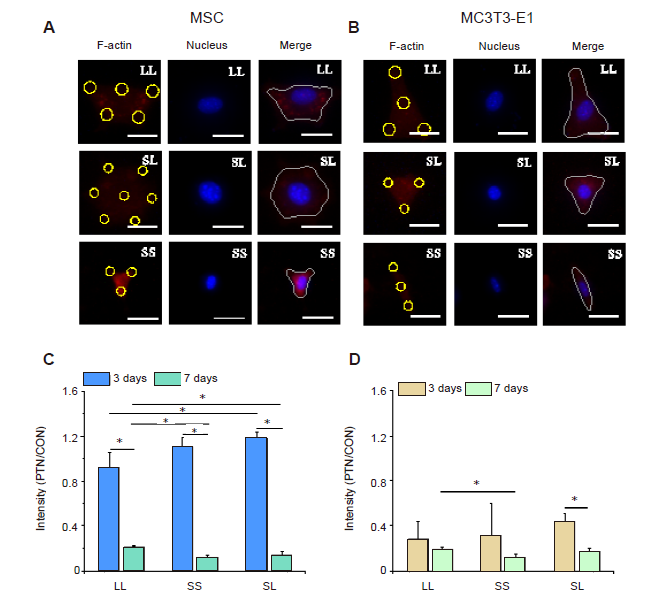
Figure 3.
P-MLC2 in cells cultured on micropatterned substrates. (A, B) Fluorescent images of individual MSCs (A) and MC3T3-E1 cells (B) stained with TRITC-labeled P-MLC2 (red) with Hoechst 33342-stained nuclei (blue) at 3 days after seeding. The yellow circles represent the location of micropatterned islands. The gray shape represents the spreading shape of cells. Scale bars: 50 μm. (C, D) Statistical results of P-MLC2 in MSCs (C) and MC3T3-E1 cells (D). Data are presented as mean ± SD (n = 3). *P < 0.05 (one-way analysis of variance followed by Tukey’s post hoc analysis). CON: control (freely spreading group); LL: large circles with large spacing; MSC: mesenchymal stem cell; P-MLC2: phosphorylated myosin light chain 2; PTN: pattern; SL: small circles with large spacing; SS: small circles with small spacing; TRITC: tetraethyl rhodamine isothiocyanate.
The overall trends in the distribution of F-actin and P-MLC2 were similar. In the early stage of cell culture on the micropatterned substrate, both F-actin and P-MLC2 were highly expressed in the MSCs on SL, whereas MC3T3-E1 cells showed no significant difference in the expression of the two proteins among different patterns. After 7 days of culture, the LL pattern gradually promoted the expression of both proteins. The consistency of actin filament arrangement was related to the content of F-actin. These results suggest that F-actin and P-MLC2 have a synergistic relationship. The higher the F-actin expression, the higher the level of myosin phosphorylation, as well as the greater the cell tension.
Adhesion pattern regulates osteogenic differentiation of MSCs and MC3T3-E1 cells
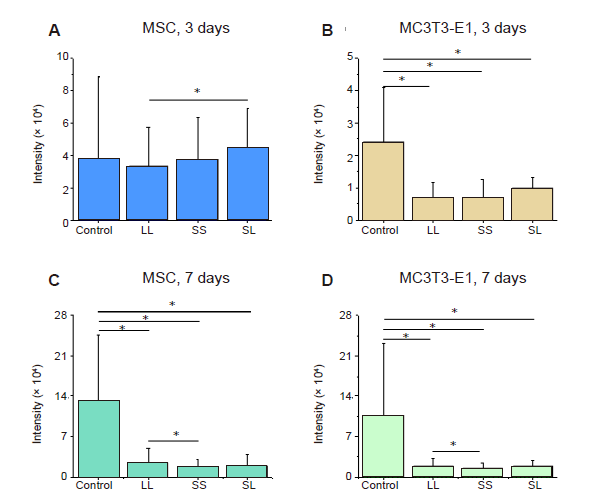
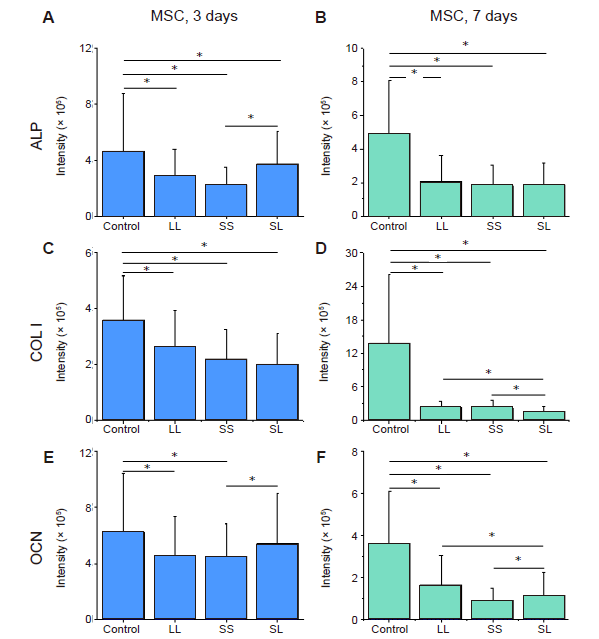
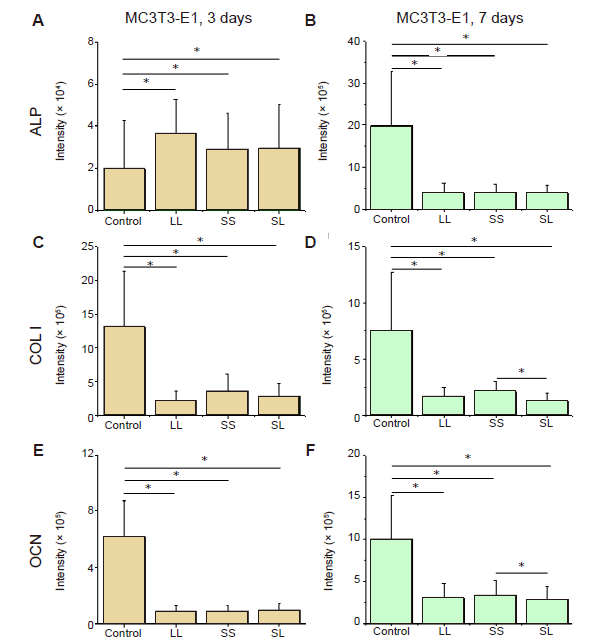
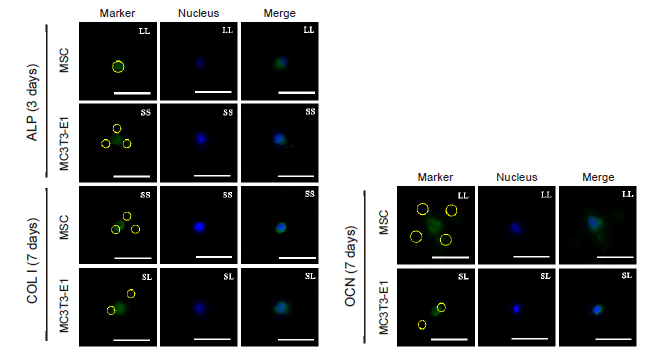
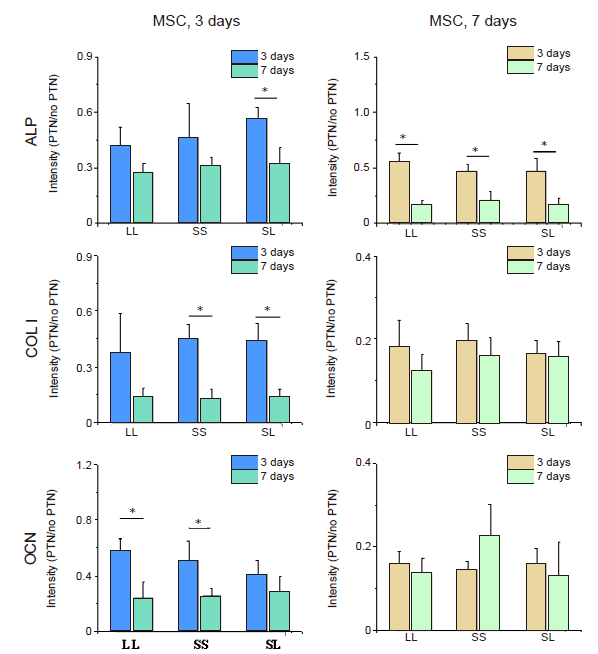
The relationship between cell adhesion and osteogenic differentiation was explored by analysing the expression of the three osteogenic differentiation markers ALP, OCN, and COL Ⅰ (Figure 4). The results showed that the relative intensity of the above markers in MSCs cultured for 3 days was significantly higher than that in cells cultured for 7 days (Figure 5A, C, E, and Additional Figure 6). High expression of ALP and OCN was detected in the MSCs on the SL pattern after 3 days of culture, while the expression levels of OCN and COL I were higher on the LL pattern after 7 days. These results indicated that in the initial culture of MSCs, the SS pattern promoted osteogenic differentiation, while the LL pattern enhanced osteogenic differentiation in the late stage. In MC3T3-E1 cells cultured on the micropatterned substrate for 3 days, the expression of ALP, OCN, and COL I showed no significant differences among the three island patterns. However, when the cells were cultured for 7 days, the SS pattern resulted in the highest expression levels of the markers (Figure 5B, D, F, and Additional Figure 7). ALP expression in the 3 days group was higher than that in the 7 days group, but OCN expression in the 3 days group was lower than in the 7 days group.
Figure 4.
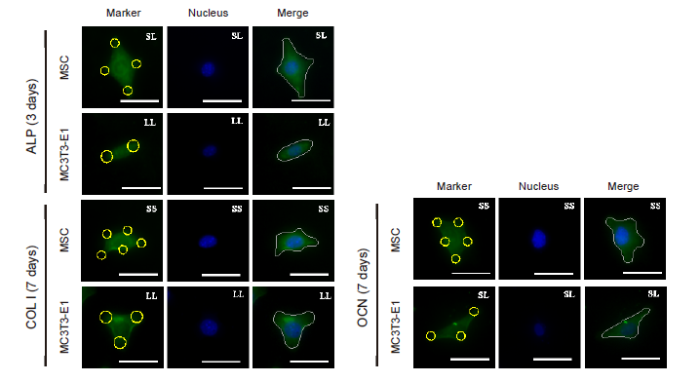
Figure 4.
FITC-labeled fluorescent images of the osteogenic differentiation markers ALP, COL I, and OCN in MSCs and MC3T3-E1 cells cultured on a micropatterned substrate after 3 (ALP) or 7 (COL I, OCN) days of culture. Cells might spread out into triangles, dumbbells, etc. The yellow circles indicate the location of micropatterned islands. The gray shape represents the spreading shape of cells. Scale bars: 50 μm. ALP: alkaline phosphatase; COL I: type I collagen; FITC: fluorescein isothiocyanate; MSC: mesenchymal stem cell; OCN: osteocalcin.
Figure 5.
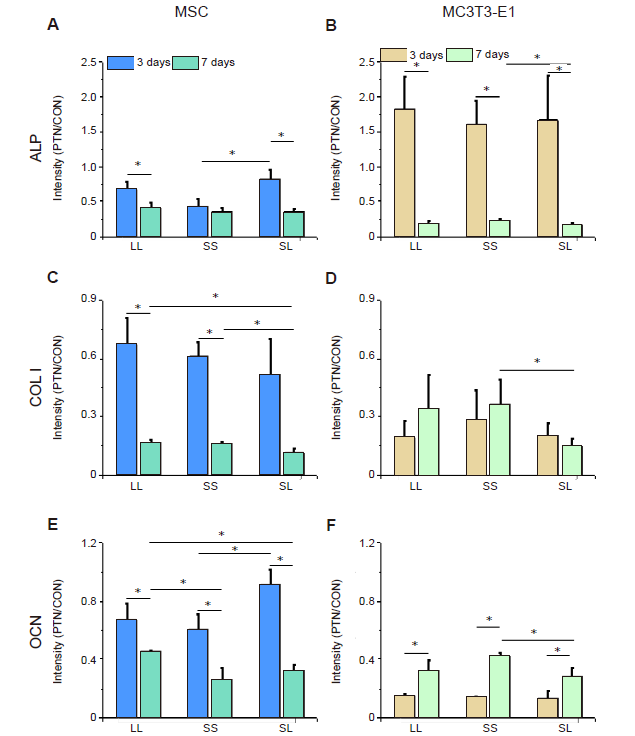
Figure 5.
Intensity of osteogenic differentiation markers in cells cultured on a micropatterned substrate. (A-F) Relative fluorescent intensity of ALP, COL I, and OCN in MSCs (A, C, E) and MC3T3-E1 cells (B, D, F). Data are presented as mean ± SD (n = 3). *P < 0.05 (one-way analysis of variance followed by Tukey’s post hoc analysis). ALP: alkaline phosphatase; COL I: type I collagen; CON: control (freely spreading group); LL: large circles with large spacing; MSC: mesenchymal stem cell; OCN: osteocalcin; PTN: pattern; SL: small circles with large spacing; SS: small circles with small spacing.
Intracellular YAP distribution is influenced by adhesion pattern
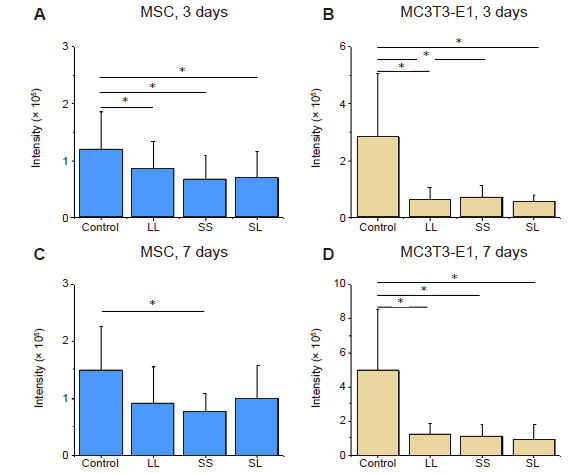
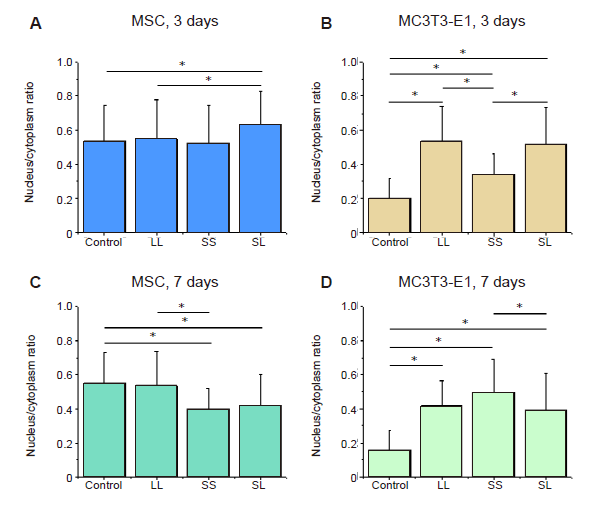
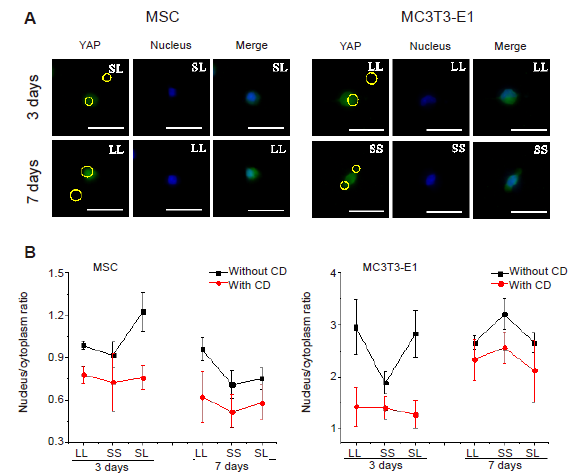
YAP is a transcription coactivator responsible for transferring mechanical signals together with Rho-GTP enzyme to the nucleus, thereby affecting the transcription of downstream genes.35, 36 We performed immunofluorescence staining for intracellular YAP to explore whether YAP participates in osteogenic differentiation regulated by growth on a micropatterned substrate. Figure 6A shows typical YAP fluorescence images. The fluorescence intensity of the cytoplasm outside the contour region was lower than that inside the nuclear region. The nuclear transfer of YAP in MSCs grown on the SL pattern was evident in the 3 days group and on the LL pattern in the 7 days group although no significant difference was observed in the average intracellular intensity of YAP (Figure 6B and D, and Additional Figures 8A, C, and 9A, C). In contrast, MC3T3-E1 cells showed obvious nuclear localisation only on the SS pattern in the 7 days group (Figure 6C and E, and Additional Figures 8B, D, and 9B, D).
Figure 6.
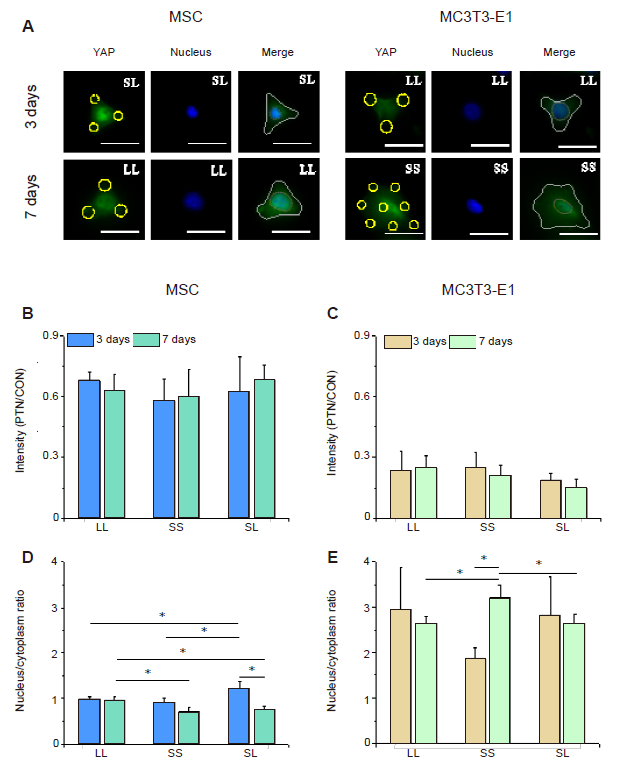
Figure 6.
YAP staining in cells cultured on a micropatterned substrate. (A) Fluorescent images of individual cells stained with fluorescein isothiocyanate-labeled YAP (green) with Hoechst 33342-stained nuclei (blue) after 3 or 7 days of culture on the micropatterned substrate. Yellow circles indicate the location of micropatterned islands, and yellow dotted circles show the outlines of nuclei. The gray shape represents the spreading shape of cells. Scale bars: 50 μm. (B, C) Statistical analyses of the fluorescence intensity of YAP in MSCs and MC3T3-E1 cells, respectively. (D, E) Statistical analyses of the nuclear/cytoplasmic ratio of YAP in MSCs and MC3T3-E1 cells, respectively. Data are presented as mean ± SD (n = 3). *P < 0.05 (one-way analysis of variance followed by Tukey’s post hoc analysis). CON: control (free spreading group); LL: large circles with large spacing; MSC: mesenchymal stem cell; PTN: pattern; SL: small circles with large spacing; SS: small circles with small spacing; YAP: yes-associated proteins.
The cytoskeleton influences osteogenic differentiation of MSCs
To confirm the positive role of the cytoskeleton in osteogenic differentiation, cytochalasin D was added during cell culture for 24 hours. The spreading state appeared abnormal and shrinkage occurred after CD treatment (Additional Figure 10A), so that the spreading area of CD-treated cells was considerably smaller than that of untreated cells (Additional Figure 10B). Fluorescence images showed that intracellular F-actin was fragmented and bundles of stress fibres were not evident in the CD-treated group (Additional Figure 11A). Cells subjected to CD treatment were not sensitive to the micropatterned substrate, and no significant differences were observed among the groups (Additional Figure 11B and C). However, differences in F-actin assembly were observed between the 3 days and 7 days groups before CD treatment (Figure 2C-F). The effect of CD treatment on the expression of osteogenic differentiation markers was also analysed, and showed that their micropattern-dependent expression patterns disappeared (Additional Figures 12 and 13). No nuclear localisation of YAP was evident after CD treatment, and the ratio of nuclear/cytoplasmic YAP decreased (Additional Figure 14). These results indicate that the cytoskeleton regulates osteogenic differentiation of MSCs and MC3T3-E1 cells.
Discussion
We used micropattern technology to study the effect of the spacing and area of focal adhesions on osteogenic differentiation of MSCs and MC3T3-E1 cells. We found that cells grown on micropatterned substrates spread and formed different shapes, such as triangles, spindles, or rhombi. The patterned substrates reduced the spreading area of MSCs and MC3T3-E1 cells, but in spite of this TUNEL results showed that they did not increase the incidence of apoptosis in either cell type.
In our previous studies, we investigated the effect of cell shape and area on osteogenic differentiation of individual osteoblasts36 and individual MSCs.37 In this study we analysed the effect of size and spacing of adhesion islands on the biological behaviours of MSCs and osteoblasts. To test this, we constructed three patterns, of which LL and SL had the same spacing of 36 µm, while SS and SL had the same diameter of 8 μm, and LL and SS had the same ratio of 9% of patterned area to total area. In fact, the effect of small islands with diameter of 3 or 5 μm on the differentiation of MSCs had been studied previously by using micro-contact printing technology.38 However due to the limit of this technology, it is difficult to construct a pattern less than 2 μm in size so as to span orders of magnitude although the size of focal adhesions may vary from 1 μm to 10 μm for fibroblasts.39, 40
We stained cells for F-actin and P-MLC2 to verify the hypothesis that the cytoskeleton could be reorganised to produce tension during spreading on a patterned substrate. Strong actin fibre bundles can be assembled at the cell edges on a patterned surface, and thus a cell tries to increase its spreading area in response to changes in the surrounding environment. The results of fluorescence staining showed that the level of actin that assembled inside cells on the SL substrate was higher in the early stage of MSC culture than in the late stage. When culture time was extended, the LL pattern promoted polymerisation of the cytoskeleton. Responses in MC3T3-E1 cells differed from those in MSCs. At 3 days of culture, the difference among the cytoskeletons in cells on different substrates was not significant. However, after 7 days of culture, the LL surface promoted cytoskeleton aggregation. Statistical results showed that high consistency of F-actin improved polymerisation. The results of P-MLC2 staining were similar to those of F-actin. Given that the cytoskeleton is a highly dynamic structural system, we speculated that the cells would generate a series of complex reactions after culture on different patterned substrates. In the patterned MC3T3-E1 cells, the content of F-actin at 7 days showed a significant difference compared with that at 3 days. The osteoblast-like MC3T3-E1 cells might represent cells that are further along the osteogenic differentiation pathway compared to MSCs, and it may take a long time for them to receive mechanical stimulation that can be converted to biological signals. Thus, differences between the three groups were detected at 7 days but not at 3 days (Figure 7).
Figure 7.
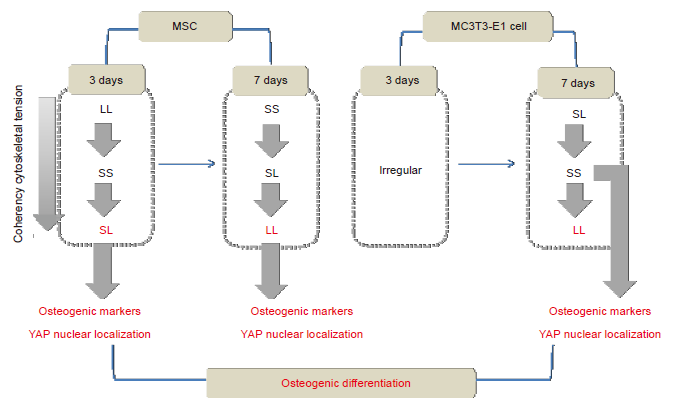
Figure 7.
Summary of the mechanism via which focal adhesion distribution regulates osteogenic differentiation. LL: large circles with large spacing; MSC: mesenchymal stem cell; SL: small circles with large spacing; SS: small circles with small spacing; YAP: yes-associated proteins.
Our results also showed that expression of the osteogenic differentiation marker proteins ALP, OCN, and COL I was closely related to the distribution of the cytoskeleton. Cytoskeletal tension and osteogenic differentiation both increase with the cytoskeletal consistency of MSCs. In MC3T3-E1 cells, the LL surface caused aggregation of F-actin and improved the consistency of F-actin compared with the other surfaces, but did not promote osteogenic differentiation. The cells on the SS surface had less tension, lower consistency, and higher expression of osteogenic markers than the cells on the other surfaces. These results were in contrast to those obtained from MSCs. When the cells were cultured on a substrate with micropatterned adhesive islands, cell adhesion was constrained and the cells could not spread freely. The fluorescence intensity of F-actin, P-MLC2, and osteogenic makers in cells on the micropatterned regions was mostly less evident than in cells on a nonpatterned surface. Thus a micropatterned surface was not beneficial to the formation of F-actin and osteogenic differentiation of the cells. On the substrates with different patterns, the cells were able to organise and assemble adherent-plaque proteins at fixed locations so that the cytoskeleton could continuously aggregate and strengthen at adhesion spots to support cell spreading. As a result, the patterns with different areas and spacings changed the circularity of the cells, and consequently affected the formation of F-actin, cytoskeletal tension, and ultimately cell differentiation.41
In the present study, the intracellular distribution of the transcription coactivator YAP played a positive role in the regulation of osteogenic differentiation. The nuclear localisation of YAP/TAZ was evident in cells cultured on the pattern that promoted osteogenic differentiation. A previous study showed that cell morphology regulates YAP signalling and does not depend on cell-cell junctions.42 In addition, substrate stiffness mediates the differentiation of MSCs through the YAP pathway.43 The present study found that patterns with controlled spacing and area led to cytoskeletal reorganisation and finally regulated the osteogenic differentiation of cells, possibly through the YAP signalling pathway.
During osteogenic differentiation of MSCs, the intracellular signalling pathways and gene expression change according to the different stages.44 Our results showed that in the early stages of MSC differentiation, i.e. after 3 days of culture on a micropatterned substrate, MSCs exhibited the preliminary characteristics of differentiation such as a higher level of expression of ALP compared with 7 days cultures. In addition, MC3T3-E1 osteoblasts represent a later stage of osteogenic differentiation compared with MSCs. Our results showed that 7-day culture on a micropatterned substrate promoted higher expression of COL I and OCN than in the 3 days group. These results indicated that the two types of cells had different phenotypes consistent with their differentiation stages.
There were some limitations in this study. It is still unclear what signal pathways were initiated in the process of osteogenic differentiation of the cells on the micropatterned surface although YAP pathway has been investigated. The relation between actin structure and YAP nuclear translocation needs to be clarified in the future. In addition, more parameters of adhesion islands should be designed so as to give a full understanding about the effect of adhesion properties on cell differentiation.
In conclusion, we investigated the osteogenic differentiation of MSCs and MC3T3-E1 cells cultured on substrates with different focal adhesion-scale patterns. The results showed that osteogenic differentiation of MSCs was mainly observed on the SL and LL patterns but that of MC3T3-E1 cells occurred on the SS pattern. The expression of osteogenic markers was consistent with the results of F-actin, P-MLC2, and YAP staining.
Author contributions
YZ and BH designed the research; YZ and BH performed the research; YZ performed the experiment; YZ, BH and SQ analyzed experimental data; YZ and BH wrote the article. All authors reviewed the manuscript.
Financial support
This work was supported by the National Key R & D Program of China, No. 2018YFF0300800 and the National Natural Science Foundation of China, Nos. 11572043 and 11372043 (all to BH).
Acknowledgement
None.
Conflicts of interest statement
We declare that we have no conflicts of interest.
Open access statement
This is an open access journal, and articles are distributed under the terms of the Creative Commons Attribution-NonCommercial-ShareAlike 4.0 License, which allows others to remix, tweak, and build upon the work non-commercially, as long as appropriate credit is given and the new creations are licensed under the identical terms.
Additional files
Additional Figure 1: Statistical analysis of the fluorescence intensity of TUNEL-stained cells cultured on micropatterned substrates.
Additional Figure 2: Statistical analysis of the area and circularity of focal adhesions.
Additional Figure 3: Statistical results of fluorescence intensity of F-actin.
Additional Figure 4: Statistical results of F-actin coherency.
Additional Figure 5: Statistical results of fluorescence intensity of P-MLC2.
Additional Figure 6: Fluorescence intensity of osteogenic differentiation markers in MSCs cultured on micropatterned substrates.
Additional Figure 7: Fluorescence intensity of osteogenic differentiation markers in MC3T3-E1 cells cultured on micropatterned substrates.
Additional Figure 8: Statistical results of fluorescence intensity of YAP.
Additional Figure 9: Statistical analyses of the nuclear/cytoplasmic ratio of YAP.
Additional Figure 10: Cell phenotypes and area after CD treatment for 24 hours.
Additional Figure 11: Statistical results of F-actin staining after CD treatment for 24 hours.
Additional Figure 12: Fluorescent images of osteogenic differentiation markers (green, FITC-labeled) in individual cells treated with CD and cultured on the micropatterned substrates for 3 (ALP) or 7 days (COL I, OCN).
Additional Figure 13: Fluorescence intensity of osteogenic markers in cells cultured on micropatterned substrates after CD treatment.
Additional Figure 14: Statistical results of YAP localisation after CD treatment. (A) Fluorescent images of YAP. Nuclear transfer of YAP could not be observed.
Additional Figure 1.
Additional Figure 1.
Statistical analysis of the fluorescence intensity of TUNEL-stained cells cultured on micropatterned substrates. (A-D) MSCs and MC3T3-E1 cells cultured for 3 or 7 days. Data are presented as mean ± SD (n = 3). *P < 0.05 (one-way analysis of variance followed by Tukey’s post hoc analysis). LL: large circles with large spacing; MSC: mesenchymal stem cell; SL: small circles with large spacing; SS: small circles with small spacing; TUNEL: terminal deoxynucleotidyl transferase dUTP nick end labelling.
Additional Figure 2.
Additional Figure 2.
Statistical analysis of the area and circularity of focal adhesions. (A) Area of focal adhesion of MSCs. (B) Area of focal adhesion of MC3T3-E1 cells. (C) Circularity of MSCs. (D) Circularity of MC3T3-E1 cells. Data are presented as mean ± SD (n = 3). *P < 0.05 (one-way analysis of variance followed by Tukey’s post hoc analysis). CON: control; LL: large circles with large spacing; MSC: mesenchymal stem cell; SL: small circles with large spacing; SS: small circles with small spacing.
Additional Figure 3.
Additional Figure 3.
Statistical results of fluorescence intensity of F-actin. (A-D) MSCs and MC3T3-E1 cells cultured for 3 or 7 days. Data are presented as mean ± SD (n = 3). *P < 0.05 (one-way analysis of variance followed by Tukey’s post hoc analysis). LL: large circles with large spacing; MSC: mesenchymal stem cell; SL: small circles with large spacing; SS: small circles with small spacing.
Additional Figure 4.
Additional Figure 4.
Statistical results of F-actin coherency. (A-D) MSCs and MC3T3-E1 cells cultured for 3 or 7 days. The larger the value, the more ordered the actin, and the more consistent the direction of stress fibres. Data are presented as mean ± SD (n = 3). *P < 0.05 (one-way analysis of variance followed by Tukey’s post hoc analysis). LL: large circles with large spacing; MSC: mesenchymal stem cell; SL: small circles with large spacing; SS: small circles with small spacing.
Additional Figure 5.
Additional Figure 5.
Statistical results of fluorescence intensity of P-MLC2. (A-D) MSCs and MC3T3-E1 cells cultured for 3 or 7 days. Data are presented as mean ± SD (n = 3). *P < 0.05 (one-way analysis of variance followed by Tukey’s post hoc analysis). LL: large circles with large spacing; MSC: mesenchymal stem cell; P-MLC2: phosphorylated myosin light chain 2; SL: small circles with large spacing; SS: small circles with small spacing.
Additional Figure 6.
Additional Figure 6.
Fluorescence intensity of osteogenic differentiation markers in MSCs cultured on micropatterned substrates. (A-F) Statistical results of fluorescent intensity of ALP, COL I, and OCN, respectively, after culture for 3 days (A, C, E) or 7 days (B, D, F). Data are presented as mean ± SD (n = 3). *P < 0.05 (one-way analysis of variance followed by Tukey’s post hoc analysis). ALP: alkaline phosphatase; COL I: type I collagen; LL: large circles with large spacing; MSC: mesenchymal stem cell; OCN: osteocalcin; SL: small circles with large spacing; SS: small circles with small spacing.
Additional Figure 7.
Additional Figure 7.
Fluorescence intensity of osteogenic differentiation markers in MC3T3-E1 cells cultured on micropatterned substrates. (A-F) Statistical results of fluorescent intensity of ALP, COL I, and OCN in cells cultured for 3 days (A, C, E) or 7 days (B, D, F), respectively. Data are presented as mean ± SD (n = 3). *P < 0.05 (one-way analysis of variance followed by Tukey’s post hoc analysis). ALP: alkaline phosphatase; COL I: type I collagen; LL: large circles with large spacing; OCN: osteocalcin; SL: small circles with large spacing; SS: small circles with small spacing.
Additional Figure 8.
Additional Figure 8.
Statistical results of fluorescence intensity of YAP. (A-D) MSCs and MC3T3-E1 cells cultured for 3 or 7 days. Data are presented as mean ± SD (n = 3). *P < 0.05 (one-way analysis of variance followed by Tukey’s post hoc analysis). LL: large circles with large spacing; MSC: mesenchymal stem cell; SL: small circles with large spacing; SS: small circles with small spacing; YAP: yes-associated proteins.
Additional Figure 9.
Additional Figure 9.
Statistical analyses of the nuclear/cytoplasmic ratio of YAP. (A-D) MSCs and MC3T3-E1 cells cultured for 3 or 7 days. Data are presented as mean ± SD (n = 3). *P < 0.05 (one-way analysis of variance followed by Tukey’s post hoc analysis). LL: large circles with large spacing; MSC: mesenchymal stem cell; SL: small circles with large spacing; SS: small circles with small spacing; YAP: yes-associated proteins.
Additional Figure 10.
Additional Figure 10.
Cell phenotypes and area after CD treatment for 24 hours. (A) Bright-field images of the cell on the micropatterned substrates. Cells were shrunk obviously. Scale bars: 50 μm. (B) Statistical analysis of the spreading area of the cells. Data are presented as mean ± SD (n = 3). *P < 0.05 (one-way analysis of variance followed by Tukey’s post hoc analysis). CD: cytochalasin D; LL: large circles with large spacing; MSC: mesenchymal stem cell; SL: small circles with large spacing; SS: small circles with small spacing.
Additional Figure 11.
Additional Figure 11.
SStatistical results of F-actin staining after CD treatment for 24 hours. (A) Fluorescent images of F-actin in shrunk cells. Scale bars: 50 μm. (B) Statistical results of fluorescence intensity of F-actin. (C) Statistical results of F-actin coherency. The larger the value, the better the order of actin, and the more consistent the direction of stress fibre. Data are presented as mean ± SD (n = 3). *P < 0.05 (one-way analysis of variance followed by Tukey’s post hoc analysis). CD: cytochalasin D; LL: large circles with large spacing; MSC: mesenchymal stem cell; SL: small circles with large spacing; SS: small circles with small spacing.
Additional Figure 12.
Additional Figure 12.
Fluorescent images of osteogenic differentiation markers (green, FITC-labeled) in individual cells treated with CD and cultured on the micropatterned substrates for 3 (ALP) or 7 days (COL I, OCN). The yellow circles represent the location of micropatterned islands. Scale bars: 50 μm. ALP: alkaline phosphatase; CD: cytochalasin D; COL I: type I collagen; FITC: fluorescein isothiocyanate; MSC: mesenchymal stem cell; OCN: osteocalcin.
Additional Figure 13.
Additional Figure 13.
Fluorescence intensity of osteogenic markers in cells cultured on micropatterned substrates after CD treatment. Data are presented as mean ± SD (n = 3). *P < 0.05 (one-way analysis of variance followed by Tukey’s post hoc analysis). ALP: alkaline phosphatase; CD: cytochalasin D; COL I: type I collagen; LL: large circles with large spacing; MSC: mesenchymal stem cell; OCN: osteocalcin; PTN: pattern; SL: small circles with large spacing; SS: small circles with small spacing.
Additional Figure 14.
Additional Figure 14.
Statistical results of YAP localisation after CD treatment. (A) Fluorescent images of YAP. Nuclear transfer of YAP could not be observed. The yellow circles represent the location of micropatterned islands. Scale bars: 50 μm. (B) Statistical analyses of the nuclear/cytoplasmic ratio of YAP in MSCs and MC3T3-E1 cells. Data are presented as mean ± SD (n = 3), and were analysed by one-way analysis of variance followed by Tukey’s post hoc analysis. CD: cytochalasin D; LL: large circles with large spacing; MSC: mesenchymal stem cell; SL: small circles with large spacing; SS: small circles with small spacing; YAP: yes-associated proteins.
Reference
Activation, homing, and role of the mesenchymal stem cells in the inflammatory environment
DOI:10.2147/JIR URL [Cited within: 1]
Three-dimensional porous graphene nanosheets synthesized on the titanium surface for osteogenic differentiation of rat bone mesenchymal stem cells
DOI:10.1016/j.carbon.2017.09.064 URL [Cited within: 2]
Superficial physicochemical properties of polyurethane biomaterials as osteogenic regulators in human mesenchymal stem cells fates
DOI:10.1016/j.colsurfb.2017.04.059 URL [Cited within: 1]
Surface topography of hydroxyapatite promotes osteogenic differentiation of human bone marrow mesenchymal stem cells
DOI:10.1016/j.msec.2015.11.012 URL [Cited within: 1]
Differential regulation of osteogenic differentiation of stem cells on surface roughness gradients
DOI:10.1016/j.biomaterials.2014.07.015 URL
Surface morphological influence on the in vitro bioactivity and response of mesenchymal stem cells
DOI:10.1080/10667857.2017.1317062 URL [Cited within: 1]
Subcellular cell geometry on micropillars regulates stem cell differentiation
DOI:10.1016/j.biomaterials.2016.09.023 URL [Cited within: 1]
Effects of line and pillar array microengineered SiO2 thin films on the osteogenic differentiation of human bone marrow-derived mesenchymal stem cells
DOI:10.1021/acs.langmuir.5b03955 URL
Combined effects of multi-scale topographical cues on stable cell sheet formation and differentiation of mesenchymal stem cells
Cell adhesion and osteogenic differentiation on three-dimensional pillar surfaces
Gold nanoparticle size and shape influence on osteogenesis of mesenchymal stem cells
DOI:10.1039/C5NR08808A URL [Cited within: 1]
TEMPO-conjugated gold nanoparticles for reactive oxygen species scavenging and regulation of stem cell differentiation
DOI:10.1021/acsami.7b12486 URL [Cited within: 1]
The effect of culture conditions on the adipogenic and osteogenic inductions of mesenchymal stem cells on micropatterned surfaces
DOI:10.1016/j.biomaterials.2012.05.010 URL [Cited within: 3]
Discriminating the independent influence of cell adhesion and spreading area on stem cell fate determination using micropatterned surfaces
DOI:10.1038/srep28708 URL [Cited within: 1]
Cell shape, cytoskeletal tension, and RhoA regulate stem cell lineage commitment
DOI:10.1016/S1534-5807(04)00075-9 URL [Cited within: 1]
A rapid and efficient method for expansion of human mesenchymal stem cells
DOI:10.1089/ten.2005.0513 URL [Cited within: 1]
Geometric cues for directing the differentiation of mesenchymal stem cells
DOI:10.1073/pnas.0903269107 URL [Cited within: 1]
The relationship between cell adhesion force activation on nano/micro-topographical surfaces and temporal dependence of cell morphology
DOI:10.1039/C7NR04785A URL [Cited within: 1]
Cytoskeletal changes of mesenchymal stem cells during differentiation
DOI:10.1097/MAT.0b013e31802deb2d URL [Cited within: 1]
Cytoskeletal organization of human mesenchymal stem cells (MSC) changes during their osteogenic differentiation
DOI:10.1002/jcb.v93:4 URL [Cited within: 1]
Effects of functional groups of materials on nonspecific adhesion and chondrogenic induction of mesenchymal stem cells on free and micropatterned surfaces
DOI:10.1021/acsami.7b08339 URL [Cited within: 1]
Nanofibers regulate single bone marrow stem cell osteogenesis via FAK/RhoA/YAP1 pathway
DOI:10.1021/acsami.8b11449 URL [Cited within: 1]
Spreading area and shape regulate apoptosis and differentiation of osteoblasts
DOI:10.1088/1748-6041/8/5/055005 URL [Cited within: 1]
An ATP-dependent mechanism mediates intercellular calcium signaling in bone cell network under single cell nanoindentation
DOI:10.1016/j.ceca.2009.12.005 URL
Fluid Flow Induced Calcium Response in Bone Cell Network
DOI:10.1007/s12195-008-0011-0 URL
Osteocytic network is more responsive in calcium signaling than osteoblastic network under fluid flow
DOI:10.1002/jbmr.1474 URL [Cited within: 1]
Dissecting Collective Cell Behavior in Polarization and Alignment on Micropatterned Substrates
DOI:10.1016/j.bpj.2015.06.058 URL [Cited within: 1]
Fabrication of biofunctionalized quasi-three-dimensional microstructures of a nonfouling comb polymer using soft lithography
DOI:10.1002/(ISSN)1616-3028 URL [Cited within: 2]
Chromatin fractal organization, textural patterns, and circularity of nuclear envelope in adrenal zona fasciculata cells
NIH Image to ImageJ: 25 years of image analysis
Experimental investigation of collagen waviness and orientation in the arterial adventitia using confocal laser scanning microscopy
DOI:10.1007/s10237-011-0325-z URL [Cited within: 1]
Roles of the cytoskeleton, cell adhesion and rho signalling in mechanosensing and mechanotransduction
Mechanics of cell mechanosensing on patterned substrate
DOI:10.1115/1.4032907 URL [Cited within: 1]
Fabrication of RGD micro/nanopattern and corresponding study of stem cell differentiation
DOI:10.1021/nl5049862 URL [Cited within: 1]
Role of YAP/TAZ in mechanotransduction
DOI:10.1038/nature10137 URL [Cited within: 1]
Cellular microenvironments reveal defective mechanosensing responses and elevated YAP signaling in LMNA-mutated muscle precursors
Spreading shape and area regulate the osteogenesis of mesenchymal stem cells
DOI:10.1007/s13770-019-00213-y URL [Cited within: 1]
Cell shape provides global control of focal adhesion assembly
DOI:10.1016/S0006-291X(03)01165-3 URL [Cited within: 1]
Focal adhesion size uniquely predicts cell migration
DOI:10.1096/fsb2.v27.4 URL [Cited within: 1]
Interplay of geometric cues and RGD/BMP-2 crosstalk in directing stem cell fate
DOI:10.1021/acsbiomaterials.7b00279 URL [Cited within: 1]
Stem cell shape regulates a chondrogenic versus myogenic fate through Rac1 and N-cadherin
DOI:10.1002/stem.v28:3 URL [Cited within: 1]
Hippo pathway regulation by cell morphology and stress fibers
DOI:10.1242/dev.070987 URL [Cited within: 1]
Effect of cell geometry on yap localization of mesenchymal stem cells on micropatterned surfaces
Surface functionalization of microgrooved titanium with dual growth factor-releasing nanoparticles for synergistic osteogenic differentiation of human mesenchymal stem cells
DOI:10.1016/j.colsurfb.2015.08.011 URL [Cited within: 1]
